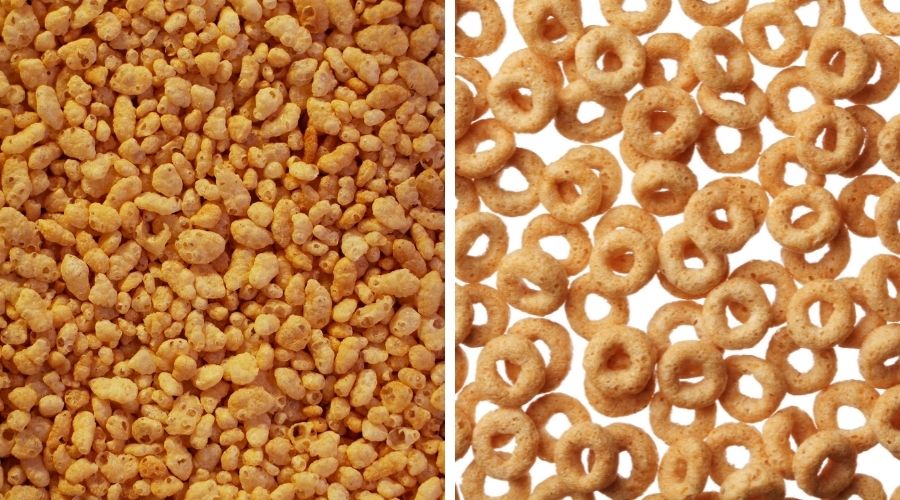
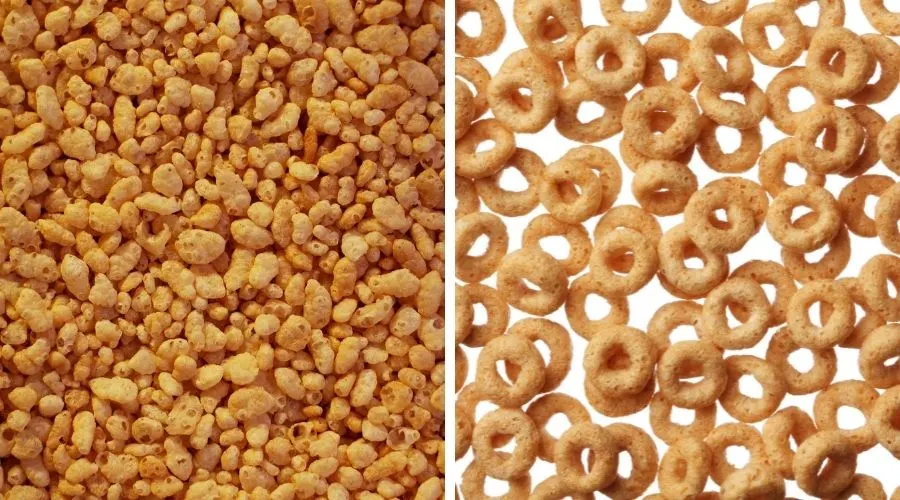
Rice Krispies and Cheerios are both staple breakfast cereal choices, and you might think there’s little nutritional difference between the two, but surprisingly there is.
In this article, I’ll be comparing Rice Krispies head-to-head in each nutritional category to provide you with the data to decide which cereal of the two is best for you and your family.
Including an ingredients comparison and poll to find out which is the public favorite when it comes to flavor and texture.
Also in This Article
In a hurry, or looking for something specific? Use the links below to jump to the relevant section:
Ingredients Comparision
Comparing the ingredients of the two kinds of cereal helps to get an idea of the main difference between each one.
For this ingredients comparison and throughout this article, I’ll be comparing Kellogg’s Rice Krispies and General Mills Original Cheerios (other varieties are available).
The key difference between Rice Krispies and Original Cheerios is the main ingredient, which for Rice Krispies is rice, and Cheerios is whole grain oats.
Both kinds of cereal contain added sugar and salt for extra flavor, and both are fortified with vitamins and minerals, which I’ll go through in-depth later in this article.
| Rice Krispie Ingredients | Original Cheerios Ingredients |
| Rice, sugar, contains 2% or less of salt, malt flavor. | Whole Grain Oats, Corn Starch, Sugar, Salt, Tripotassium Phosphate. Vitamin E (mixed tocopherols) Added to Preserve Freshness. |
Rice Krispies Vs. Cheerios Nutritional Comparison
We’ll now look at the nutritional comparison, and to ensure accuracy, this will be done on a weight-for-weight basis (per 100g of cereal).
I’ve also included the serving data; however, please note the recommended serving weight of each cereal is slightly different.
Best for Calorie Content
If you’re looking to reduce your calorie intake, the cereal with the least calories is Original Cheerios, which contain 16 fewer calories per 100g than Rice Krispies.
There’s not much calorific difference between the two kinds of cereal, and per serving, they’re relatively similar.
| Cereal Type | Calories Per 100g | Calories Per Serving |
| Rice Krispies | 375kcal | 150kcal (per 40g Serving) |
| Original Cheerios | 359kcal | 140kcal (per 39g Serving) |
Best for Carbohydrate Content
I’ve included carbohydrates for information but not in the overall comparison because neither cereal can be considered a low-carb breakfast option.
So for information, the cereal that is lowest in carbs is Original Cheerios, which contain 16g fewer carbs per 100g compared to Rice Krispies.
| Cereal Type | Carbohydrates Per 100g | Carbohydrates Per Serving |
| Rice Krispies | 90g | 36g (per 40g Serving) |
| Original Cheerios | 74g | 29g (per 39g Serving) |
Best for Sugar Content
Sugar content is an important consideration for consumers when choosing the best breakfast cereal and when choosing between the two, Original Cheerios contain less sugar than Rice Krispies.
Per weight, Rice Krispies contain double the amount of sugar as Cheerios, and each serving contains 8% of the recommended daily value of an adult.
Compared to some other cereals, Rice Krispies aren’t too high; it’s just that Original Cheerios are particularly low in sugar.
| Cereal Type | Sugars Per 100g | Sugars Per Serving |
| Rice Krispies | 10g | 4g (per 40g Serving) |
| Original Cheerios | 5g | 2g (per 39g Serving) |
Best for Protein Content
For those who like to choose food products based on protein content, the cereal with the most protein per weight is Original Cheerios, with 2g more per serving than Rice Krispies.
| Cereal Type | Protein Per 100g | Protein Per Serving |
| Rice Krispies | 7.5g | 3g (per 40g Serving) |
| Original Cheerios | 12.8g | 5g (per 39g Serving) |
Best for Fat Content
When cereal is made from whole grains, it will contain a small amount of natural fat and which is true of Original Cheerios, which are made from whole grain oats.
Based on this information, Cheerios contain 6.4g of fat per 100g, whereas Rice Krispies don’t have any, and for information, neither kind of cereal contains any cholesterol.
The tables below contain the fat and saturated fat content per 100g and per serving:
Per 100g
| Cereal Type | Fat Per 100g | Saturated Fat per 100g |
| Rice Krispies | 0g | 0g |
| Original Cheerios | 6.4g | 2.5g |
Per Recommended Serving
| Cereal Type | Fat Per Serving | Saturated Fat per Serving |
| Rice Krispies (per 40g Serving) | 0g | 0g |
| Original Cheerios (per 39g Serving) | 2.5g | 0.5g |
Best for Fiber Content
Fiber content is another important consideration when choosing a cereal. When comparing Rice Krispies and Cheerios, Original Cheerios are the best option because they contain 4g of fiber per serving, whereas Rice Krispies don’t have any.
This is an example where if you’re looking to increase your fiber content, it’s better to choose cereals made from whole grains (especially bran) instead of rice or corn-based options.
| Cereal Type | Dietary Fibre Per 100g | Dietary Fibre per Serving |
| Rice Krispies | 0g | 0g (per 40g Serving) |
| Original Cheerios | 10.3g | 4g (per 39g Serving) |
Best for Sodium/Salt Content
Both kinds of cereal contain added salt in the ingredients, and although they have similar sodium levels, the cereal which is slightly higher per weight is Rice Krispies.
To put this into the context of a daily recommended value for an adult, Rice Krispies contain 9%, whereas Original Cheerios contain 8%.
| Cereal Type | Sodium/Salt Per 100g | Sodium/Salt per Serving |
| Rice Krispies | 500mg | 200mg (per 40g Serving) |
| Original Cheerios | 487mg | 190mg (per 39g Serving) |
Best for Vitamins/Minerals
Rice Krispies and Original Cheerios are fortified with added vitamins and minerals to help consumers get more nutrients into their diet at breakfast time.
Although Rice Krispies contain higher levels of some vitamins and minerals, Original Cheerios contain more kinds of nutrients and are higher than Rice Krispies in more categories.
| Vitamin/Mineral Type | Rice Krispies Daily Value % | Original Cheerios Daily Value % |
| Vitamin D | 15% | 10% |
| Calcium | – | 10% |
| Iron | 60% | 70% |
| Phosphorus | – | 10% |
| Potassium | – | 6% |
| Magnesium | – | 15% |
| Thiamin | 30% | 20% |
| Riboflavin | 30% | – |
| Vitamin B6 | 30% | 20% |
| Vitamin C | – | 10% |
| Vitamin A | – | 10% |
| Vitamin B12 | 30% | 20% |
| Niacin | 30% | 10% |
| Folic Acid | 50% | 20% |
| Zinc | – | 20% |
Overall Winner & Summary
We’ve now compared all nutritional elements of each cereal, and the winner of the most categories between Rice Krispies and Cheerios is – Original Cheerios!
Compared to Rice Krispies, Cheerios are lower in calories, sugar, and sodium, while being higher in protein, fiber, and most vitamins and minerals, making them the healthier option of the two.
It still comes down to which you like best, but if you’re looking for a healthier choice, this article’s data can help you decide.
| Comparison Category | Winner (Rice Krispies or Original Cheerios) |
| Best for Calorie Content | Original Cheerios |
| Best for Sugar Content | Original Cheerios |
| Best for Protein Content | Original Cheerios |
| Best for Fat Content | Rice Krispies |
| Best for Fiber Content | Original Cheerios |
| Best for Sodium Content | Original Cheerios |
| Best for Vitamins/Minerals | Original Cheerios |
| Overall Winner | Original Cheerios |
Best for Flavor/Texture
To judge which cereal is best for flavor and texture, we need to get a more comprehensive opinion from a broad range of voters.
Please help us out by voting for your favorite in the poll below (Rice Krispies or Original Cheerios), and once you vote, the winner so far will be revealed (no personal information is required to vote).
Related Articles
I hope this article has helped you to find the information you were looking for; you might also find the following articles helpful too:
Fiber One Vs. Cheerios (Which is Better?)
Fiber One Vs. Raisin Bran (Which is Better?)
Babybel Vs. Babybel Light (What’s the Difference?)
References Used for this Article
To ensure the nutritional information used in this article is accurate, I have used data from the manufacturer; the links below contain the source information: