If you’re trying to decide between Golden Grahams and Cinnamon Toast Crunch as a breakfast cereal, but you don’t know which one to choose – then look no further because we will give you everything you need to help you decide which one is best for you!
In this article, I’ll be comparing the cereals head-to-head to find out which is best for calories, nutrition, flavor, and cost to find out who wins the most categories to become the overall winner.
Also, you can help our future readers and us decide on the best cereal for flavor and texture by voting in our poll.
Also in This Article
In a hurry, or looking for something specific? Use the links below to jump to the relevant section:
- Ingredients Comparison
- Golden Grahams Vs. Cinamon Toast Crunch Nutritional Comparison:
- Best for Calorie Content
- Best for Carbs & Sugar Content
- Best for Protein Content
- Best for Fat Content
- Best for Fiber Content
- Best for Sodium/Salt Content
- Best for Vitamins/Minerals
- Best for Flavor/Texture
- Best for Price
- Overall Winner
Ingredients Comparision
When comparing the ingredients of the two kinds of cereal, they look pretty similar, which makes sense because they’re both made by the manufacturer General Mills.
The main ingredient of both Golden Grahams and Cinnamon Toast Crunch is whole grain wheat, and Golden Grahams also contain cornmeal, whereas Cinnamon Toast Crunch contains rice flour.
Along with various flavorings and added ingredients, both kinds of cereal are fortified with the same vitamins and minerals to help the consumer reach their recommended daily values (amounts of which I’ll cover later in the article).
| Cereal Type | Ingredients | Vitamins and Minerals |
| Golden Grahams Cereal | Whole Grain Wheat, Corn Meal, Sugar, Brown Sugar Syrup, Canola and/or Sunflower Oil, Honey, Baking Soda, Salt, Dextrose, Trisodium Phosphate, Natural Flavor | Calcium Carbonate, Iron and Zinc (mineral nutrients), Vitamin C (sodium ascorbate), A B Vitamin (niacinamide), Vitamin B6 (pyridoxine hydrochloride), Vitamin B2 (riboflavin), Vitamin B1 (thiamin mononitrate), Vitamin A (palmitate), A B Vitamin (folic acid), Vitamin B12, Vitamin D3. |
| Cinnamon Toast Crunch | Whole Grain Wheat, Sugar, Rice Flour, Canola Oil, Fructose, Maltodextrin, Dextrose, Salt, Cinnamon, Trisodium Phosphate, Soy Lecithin, Caramel Color. BHT Added to Preserve Freshness. | Calcium Carbonate, Iron and Zinc (mineral nutrients), Vitamin C (sodium ascorbate), A B Vitamin (niacinamide), Vitamin B6 (pyridoxine hydrochloride), Vitamin B2 (riboflavin), Vitamin B1 (thiamin mononitrate), Vitamin A (palmitate), A B Vitamin (folic acid), Vitamin B12, Vitamin D3. |

Golden Grahams Vs. Cinnamon Toast Crunch Nutritional Comparison
Moving on to the nutritional comparison and to keep things fair and accurate, this will be done per weight (100g) and not per serving which is different for each cereal. However, I’ll still include the serving values for information.
For clarification, the cereal brand for each cereal is General Mills, and the cereals are Original Golden Grahams and Cinnamon Toast Crunch.
Best for Calorie Content
The winner of the cereal with the lowest calorie content is Golden Grahams, which contains 367kcal per 100g of cereal, compared to Cinnamon Toast Crunch, which has 415kcal.
| Cereal Type | Calories Per 100g | Calories Per Serving |
| Golden Grahams | 367kcal | 110kcal (Per 30g Serving) |
| Cinnamon Toast Crunch | 415kcal | 170kcal (Per 41g Serving) |
Best for Carbohydrate Content
Neither Golden Grahams nor Cinnamon Toast Crunch are low-carbohydrate options, but if you need to compare the two, Golden Grahams are the slightly lower carb option per weight of cereal.
| Cereal Type | Carbohydrates Per 100g | Carbohydrates Per Serving |
| Golden Grahams | 83g | 25g (Per 30g Serving) |
| Cinnamon Toast Crunch | 80g | 33g (Per 41g Serving) |
Best for Sugar Content
Both kinds of cereal are high in sugar when compared to other breakfast options, which, let’s be honest, is what makes them taste so good.
Cinnamon Toast Crunch is slightly lower in sugar per weight than Golden Grahams, but both contain the equivalent of nearly two tablespoons of sugar per 100g of cereal. If you’re looking for a low sugar option, you might need to look at other cereal options instead.
| Cereal Type | Sugars Per 100g | Sugars Per Serving |
| Golden Grahams | 30g | 9g (Per 30g Serving) |
| Cinnamon Toast Crunch | 29g | 12g (Per 41g Serving) |
Best for Protein Content
When it comes to protein content, neither kind of cereal is exceptionally high in protein, but if this is an important consideration for you, the higher protein option is Golden Grahams, which contain 2g more protein per 100g than Cinamon Toast Crunch.
| Cereal Type | Protein Per 100g | Protein Per Serving |
| Golden Grahams | 7g | 2g (Per 30g Serving) |
| Cinnamon Toast Crunch | 5g | 2g (Per 41g Serving) |

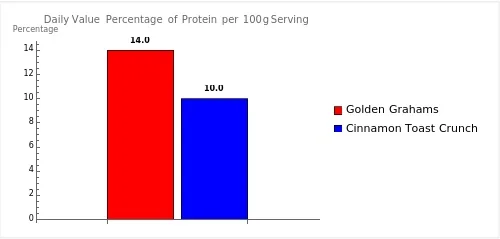
The graph shows that Golden Grahams provide 14% and Cinnamon Toast Crunch provides 10% of the daily value for protein per 100g serving. The recommended daily intake of protein is about 50 grams for the average sedentary adult.
Best for Fat Content
Golden Grahams and Cinnamon Toast Crunch are relatively low in fat per serving, and you’ll be pleased to know that neither cereal contains any saturated fat.
Although this is a relatively insignificant amount, Golden Graham’s win this category with 7g less fat per 100g than Cinnamon Toast Crunch.
The tables below show the fat and saturated fat for each kind of cereal and are split out per weight and serving.
Per 100g
| Cereal Type | Fat Per 100g | Saturated Fat per 100g |
| Golden Grahams | 3g | 0g |
| Cinnamon Toast Crunch | 10g | 0g |

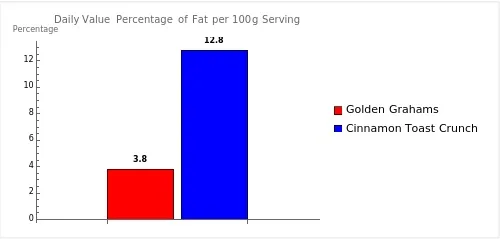
The graph shows that Golden Grahams provide approximately 3.8% and Cinnamon Toast Crunch provides about 12.8% of the daily value for fat per 100g serving. The recommended daily intake of fat is about 78 grams for the average adult.
Per Recommended Serving
| Cereal Type | Fat Per Serving | Saturated Fat per Serving |
| Golden Grahams (Per 30g Serving) | 1g | 0g |
| Cinnamon Toast Crunch (Per 41g Serving) | 4g | 0g |
Cholesterol
If you need to keep track of your cholesterol consumption, I can confirm that neither cereal contains any cholesterol.
Best for Fiber Content
When people choose a breakfast cereal, they tend to go for a higher fiber option which will help them get towards their recommended fiber intake for the day.
Neither golden Graham’s nor Cinnamon Toast Crunch can be classed as high fiber cereals compared to other options such as high-bran cereals. However, if you have to choose one between the two that is slightly higher in fiber, Cinnamon Toast Crunch is the better option with 1g more dietary fiber per serving.
| Cereal Type | Dietary Fibre Per 100g | Dietary Fibre per Serving |
| Golden Grahams | 3g | 1g (Per 30g Serving) |
| Cinnamon Toast Crunch | 5g | 2g (Per 41g Serving) |
Best for Sodium/Salt Content
You don’t really think of breakfast cereals being high in sodium, but it’s an ingredient usually added to help improve flavor.
Although Golden Graham’s and Cinnamon Toast Crunch appear to have the same sodium per serving, weight for weight Golden Graham’s contain slightly more.
To put this into the context of a recommended daily value, this is equal to around 10% of an adult’s allowance.
| Cereal Type | Sodium/Salt Per 100g | Sodium/Salt per Serving |
| Golden Grahams | 767mg | 230mg (Per 30g Serving) |
| Cinnamon Toast Crunch | 561mg | 230mg (Per 41g Serving) |

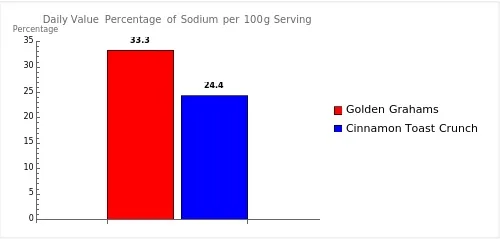
The graph shows that Golden Grahams provide approximately 33.3% and Cinnamon Toast Crunch provides about 24.4% of the daily value for sodium per 100g serving. The recommended daily intake of sodium is less than 2,300 milligrams for the average adult.
Best for Vitamins/Minerals
Both golden Grahams and Cinnamon Toast Crunch are fortified breakfast cereals which means they have added vitamins and minerals to help make them more healthy for the consumer.
These cereals both have the same added vitamins and minerals; however, each contains varying values, the cereal with higher values in most categories is Golden Grahams.
| Vitamin/Mineral Type | Golden Grahams % Daily Value | Cinnamon Toast Crunch % Daily Value |
| Vitamin D | 10% | 10% |
| Calcium | 10% | 10% |
| Iron | 25% | 20% |
| Phosphorus | 4% | 6% |
| Magnesium | 2% | 6% |
| Thiamin | 25% | 20% |
| Riboflavin | 25% | 10% |
| Vitamin B6 | 25% | 20% |
| Vitamin C | 10% | 10% |
| Vitamin A | 10% | 10% |
| Vitamin B12 | 25% | 20% |
| Niacin | 25% | 10% |
| Folic Acid | 25% | 20% |
| Zinc | 25% | 20% |
*mcg = microgram (1000th of a milligram) / mg = milligram (1000th of a gram)
Best for Flavor/Texture
I’ve not Included Flavour and texture in the overall competition between the two kinds of cereal because the winner of the best for taste is a subjective decision that is down to the individual.
You can help our future readers and us by voting in the poll below to tell us your favorite golden Graham’s or cinnamon toast crunch. No personal information is required, and once you vote, the winner so far will be revealed.
Best for Price
The prices were very close for each cereal, with both costing $3.98 for a family-sized box however there is slightly more cereal in the Golden Graham’s box, making them the slightly cheaper option at 21.1¢ compared to the average cost of cinnamon toast crunch, which is 21.2¢ per ounce.
It’s important to note that costs vary per pack size and between stores and can change over time. This information is correct at the time of writing this article (in March 2022).
Overall Winner
We’ve now compared Golden Grahams, and cinnamon toast crunch in all categories, and I’m pleased to announce the winner is Golden Graham’s.
This was probably one of the closest comparisons I have made so far for Food Compared, but Golden Grahams just took it at the end for being slightly cheaper.
I hope you can use this information to decide which is the best cereal for you based on your diet and your needs. Ultimately it’s always going to come down to which cereal you like the taste of best, and both are nutritionally reasonably similar.
| Comparison Category | Winner (Golden Grahams or Cinnamon Toast Crunch) |
| Best for Calorie Content | Golden Grahams |
| Best for Carbohydrate Content | Cinnamon Toast Crunch |
| Best for Sugar Content | Cinnamon Toast Crunch |
| Best for Protein Content | Golden Grahams |
| Best for Fat Content | Golden Grahams |
| Best for Fiber Content | Cinnamon Toast Crunch |
| Best for Sodium Content | Cinnamon Toast Crunch |
| Best for Vitamins/Minerals | Golden Grahams |
| Best for Price | Golden Grahams |
| Overall Winner | Golden Grahams |
Related Articles
I hope this article has helped you to find the information you were looking for; you might also find the following articles helpful too:
Fiber One Cereal Vs. All-Bran Buds
Froot Loops Vs. Fruity Pebbles (Which is Best?)
Weetos Vs. Cheerios (Which is Best?)
References Used for this Article
To ensure the nutritional information used in this article is accurate, I have used data from the manufacturer; the links below contain the source information:
