When you’re choosing a breakfast cereal for you and your family, nutrition is usually a consideration, but they need to taste good too!
I’ve been comparing breakfast cereals to find out which are best for nutrition, cost, and flavor, and in this article, I’m going to be comparing breakfast favorites Froot Loops and Cheerios head-to-head to find out what’s the difference and which is best.
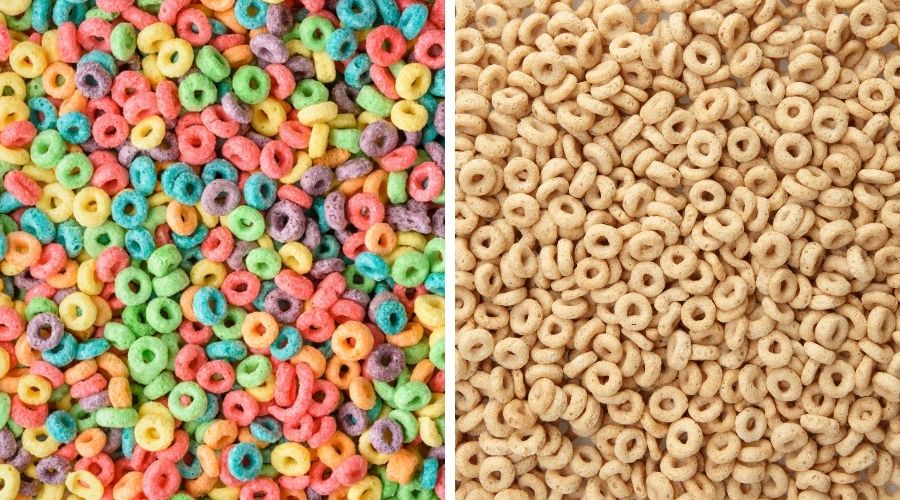
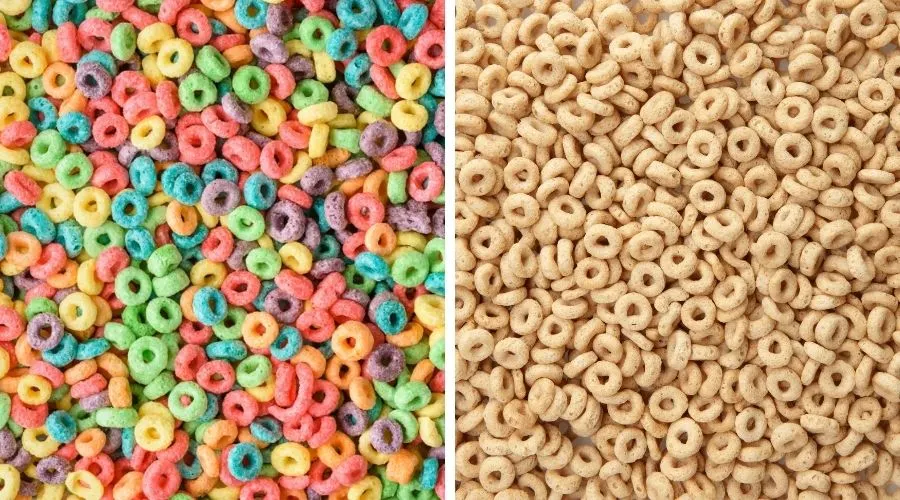
Froot Loops could be mistaken as Cheerios with added colors and flavors, but they’re actually pretty different when you compare the two – so, read on to find out more so you can decide which is best for you.
Also in This Article
In a hurry, or looking for something specific? Use the links below to jump to the relevant section:
- Ingredients Comparison
- Froot Loops Vs. Cheerios Nutritional Comparison:
- Best for Calorie Content
- Best for Carbs & Sugar Content
- Best for Protein Content
- Best for Fat Content
- Best for Fiber Content
- Best for Sodium/Salt Content
- Best for Vitamins/Minerals
- Best for Flavor/Texture
- Best for Price
- Overall Winner
Ingredients Comparision
Comparing the ingredients between the two breakfast kinds of cereal is the best way to see the real difference between the two.
When comparing Froot Loops and Original Cheerios, the main difference is that Froot Loops’ main ingredient is a blend of corn flour, whereas the main ingredient of Cheerios is Whole Grain Oats.
Both types of cereal have added sugar and salt, and Froot Loops have added flavors and colors to give them their distinctive look and taste.
Froot Loops and Cheerios are both fortified cereals which means they have added vitamins and minerals to make them healthier and help consumers reach their daily recommended nutritional intake.
| Froot Loops Ingredients | Original Cheerios Ingredients |
Corn flour blend (whole grain yellow corn flour, degerminated yellow corn flour), sugar, wheat flour, whole grain oat flour, modified food starch, contains 2% or less of vegetable oil (hydrogenated coconut, soybean and/or cottonseed), oat fiber, maltodextrin, salt, soluble corn fiber, natural flavor, red 40, yellow 5, blue 1, yellow 6, bht for freshness. | Whole Grain Oats, Corn Starch, Sugar, Salt, Tripotassium Phosphate. Vitamin E (mixed tocopherols) Added to Preserve Freshness. |
Froot Loops Vs. Cheerios Nutritional Comparison
We’ll now look at the nutritional comparison between Froot Loops and Cheerios. This will be based on a weight-for-weight comparison of 39g per serving, the recommended serving size for each cereal.
For clarification, the cereals I’ll be comparing are Kellogg’s Froot Loops against General Mills Original Cheerios (other flavors are available).
Best for Calorie Content
Starting with calorie content and the breakfast cereal with the lowest calories between the two are Cheerios which contain 10kcal less than Froot Loops per 39g serving.
There’s not too much difference between the two; however, if the calorie count is an important factor for you, then Cheerios are the better option in this category.
| Cereal Type | Calories Per 39g Serving |
| Froot Loops (Kellogg’s) | 150kcal |
| Original Cheerios (General Mills) | 140kcal |
Best for Carbohydrate Content
When it comes to carbohydrate content, neither cereal can be classed as a low-carb option, but if this is something you’re tracking, then Cheerios are the better option when comparing them to Froot Loops because they contain 5g fewer carbs per serving.
| Cereal Type | Carbohydrates Per 39g Serving |
| Froot Loops (Kellogg’s) | 34g |
| Original Cheerios (General Mills) | 29g |
Best for Sugar Content
Sugar content is often an important consideration when choosing a breakfast cereal, but they often have more than you might think.
When it comes to the sugar content of Froot Loops and Original Cheerios, Cheerios are the clear winner with 2g per serving, compared to Froot Loops which have 12g of sugar per 39g.
This means Froot Loops have two teaspoons more sugar per serving than Cheerios, and each serving of Froot Loops contains 24% of the recommended daily value, compared to Cheerios, which contain 4%.
| Cereal Type | Sugar Per 39g Serving |
| Froot Loops (Kellogg’s) | 12g |
| Original Cheerios (General Mills) | 2g |
Best for Protein Content
As consumers are becoming more aware of nutritional factors which are important for a healthy lifestyle, protein content can be an important consideration when choosing a cereal.
In this case, Original Cheerios contain 3g more protein per 39g serving than Froot Loops, making Cheerios the winner of this category.
| Cereal Type | Protein Per 39g Serving |
| Froot Loops (Kellogg’s) | 2g |
| Original Cheerios (General Mills) | 5g |
Best for Fat Content
When it comes to fat content, neither cereal can be considered high in fat when compared to other breakfast options; however, if fat is something you’re tracking, Froot Loops are slightly lower in fat when compared to Cheerios.
Both Froot Loops and Cheerios contain the same amount of saturated fat (0.5g) per serving, and neither cereal have any cholesterol.
| Cereal Type | Fat Per 39g | Of Which is Saturated Fat |
| Froot Loops (Kellogg’s) | 1.5g | 0.5g |
| Original Cheerios (General Mills) | 2.5g | 0.5g |
Best for Fiber Content
Fiber content is another important consideration for consumers when choosing a breakfast cereal.
Because Original Cheerios are predominately made from whole grain oats, they contain 2g more fiber per cereal than Froot Loops which are a corn-based cereal.
| Cereal Type | Dietary Fibre per Serving |
| Froot Loops (Kellogg’s) | 2g |
| Original Cheerios (General Mills) | 4g |
Best for Sodium/Salt Content
When you think of sweet breakfast cereal, you don’t really associate them with sodium, but this is something that is usually added for extra flavor.
Froot Loops contain slightly more sodium per serving than Cheerios. To put this into the context of a recommended daily value percentage, Froot Loops contain 12%, and Cheerios have 8%, making them the better option if you’re trying to cut down on sodium.
| Cereal Type | Sodium/Salt per 39g Serving |
| Froot Loops (Kellogg’s) | 210mg |
| Original Cheerios (General Mills) | 190mg |
Best for Vitamins/Minerals
As mentioned above, both Froot Loops and Original Cheerios are fortified with vitamins and minerals.
Although both kinds of cereal are a good source of many types of vitamins and minerals, Original Cheerios contain higher values in more categories along with a broader variety of nutrients than Froot Loops.
The table below shows the daily value percentages for each cereal based on manufacturer data:
| Vitamin/Mineral Type | Froot Loops (Kellogg’s) Daily Value % | Original Cheerios (General Mills) Daily Value % |
| Vitamin D | 10% | 10% |
| Calcium | – | 10% |
| Iron | 25% | 70% |
| Phosphorus | – | 10% |
| Magnesium | – | 20% |
| Thiamin | 20% | 20% |
| Riboflavin | 20% | – |
| Vitamin B6 | 20% | 20% |
| Vitamin C | 25% | 10% |
| Vitamin A | – | 10% |
| Vitamin B12 | 20% | 20% |
| Niacin | 20% | 10% |
| Folic Acid | 20% | 20% |
| Zinc | – | 20% |
Best for Flavor/Texture
Although they look similar, Froot Loops and Cheerios are pretty different when it comes to flavor, so it isn’t easy to judge which is best at this point without a range of opinions.
Please help our future readers and us find out which is your favorite by voting in the poll below, and once you vote, you can see the votes so far (no personal information is required).
Best for Price
Froot Loops and Cheerios are sold in different pack sizes, so to make a fair cost comparison, I have calculated the cost per ounce of cereal.
At the time of writing this article, a 19.4oz box of Kellogg’s Froot Loops costs an average of $3.64, which equates to 19¢ per ounce and a 28oz box costs $4.98, which is 18¢ per ounce.
Compared to Original Cheerios, which cost an average of $3.98 for an 18oz box or 22¢ per ounce, and a 21.7oz box costs $5.48, which is 25¢ per ounce.
Based on this information, Froot Loops cost slightly less than Cheerios per ounce than Froot Loops; however, please note costs vary per box size and depending on offers and the store where you buy them.
Overall Winner
We’ve now compared Froot Loops and Cheerios in all categories, and the cereal that has come top in the most categories is – Original Cheerios!
Cheerios are lower in calories per serving while also being lower in carbs, sugar, and sodium while being higher in protein, fiber, and certain vitamins and minerals.
Ultimately it comes down to personal taste preference, but if you like them both, Cheerios is the better option between the two, with more nutritional benefits per serving to set you up for the day.
| Comparison Category | Winner (Froot Loops or Cheerios) |
| Best for Calorie Content | Original Cheerios |
| Best for Carbohydrate Content | Original Cheerios |
| Best for Sugar Content | Original Cheerios |
| Best for Protein Content | Original Cheerios |
| Best for Fat Content | Froot Loops |
| Best for Fiber Content | Original Cheerios |
| Best for Sodium Content | Original Cheerios |
| Best for Vitamins/Minerals | Original Cheerios |
| Best for Price | Froot Loops |
| Overall Winner | Original Cheerios |
More Froot Loops Vs. Cheerios FAQ’s
Froot Loops aren’t flavored Cheerios because they’re made from different ingredients, with the main being corn-based when compared to Cheerios which are predominately made from Whole Grain Oats.
Although Froot Loops are fortified with vitamins and minerals, they’re also high in sugar and are fairly low in fiber per serving. There are healthier options such as low sugar high-fiber cereals which contain whole-grain ingredients.
Related Articles
I hope this article has helped you to find the information you were looking for; you might also find the following articles helpful too:
Froot Loops Vs. Fruity Pebbles (Which is Best?)
Golden Grahams Vs. Cinamon Toast Crunch
Brown Pasta Vs. White Pasta – (Which is Best?)
References Used for this Article
To ensure the nutritional information used in this article is accurate, I have used data from the cereal manufacturers; the links below contain the source information:
Kellogg’s Froot Loops Manufacturer Nutritional Information
General Mills Original Cheerios Manufacturer Nutritional Information